In a previous life as a PM, I wrote a lot of jira tickets. In the software development world, a “ticket” is a unit of work entered in some workflow tracking tool such as jira, but it can represent anything from a task or goal to an issue or bug. After translating a few high-level strategic projects into trees of tickets, I realized that the average ticket was pretty mediocre.
Issue #4824: Login button is broken.
This ticket provides very little contextual value. When you are on the hook for results rather merely completed tickets, this is sub-optimal. A lot of methodologies such as user story mapping invoke a structure which makes it somewhat more difficult to produce such low-value tickets, but they can still be “gamed”.
User story: As a user, I would like the login button to work.
Status quo: The login button doesn’t work.
Acceptance criteria: The login button doesn’t work.
A big revelation for me was stumbling across Simon Sinek’s Ted talk Start with Why. I am now of the opinion that the humble user story—often the least carefully considered part of the ticket—is in fact the most important part of the ticket. A well-written user story—one which effectively captures and communicates The Why—has the potential to make or break the success of a software development effort by subtly conveying intent and purpose. I have learned first-hand that tickets which focus on a crisply defined purpose rather than prescribing a set of actions ultimately correlate with successful projects.
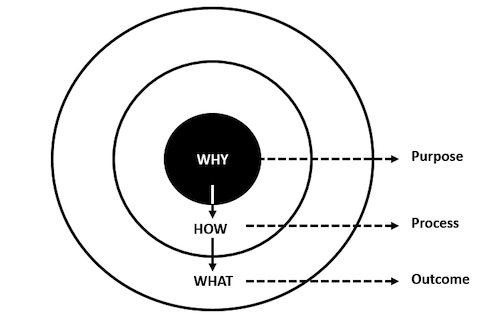
All good things come in threes.
Before I started working as a data scientist, I did not realize that this principle is just as important for interfacing between analysts ↔ stakeholders as it is for the traditional PMs ↔ developer relationship. Being on the receiving end of vaguely formulated requests has reinforced the fundamental importance of communicating The Why on projects where work spans across multiple people or teams.
Why start with why?
The modern knowledge worker works in a highly specialized environment. Specialization improves efficiency, but it comes at a less reactivity and adaptability to change. As units of work grow beyond the span of a single agent, it imposes a trade-off. But we can hack this trade-off. In an organization with multiple actors, the question shouldn’t be Is collaboration worth it? but rather How can we reduce the cost of collaboration? A natural place to start is in the written form of the request/job/project/task.
There is a common failure mode with technical support, and is commonly referred to as the XY Problem, which manifests when a customer with some underlying goal X makes an inferential leap to a sub-problem Y but then does not commmunicate that inferential leap when asking for help. If you are on the receiving end of an unclear request, the Five Why’s technique is a useful approach to uncovering the true root cause or issue at play. If you are on the dispatching end of a request, then Starting with Why is a prophylactic technique to avoid the message being interpreted incorrectly to begin with.
The “why” of data analysis
Data analysis has a aura of objectivity, but in practice it frequently involves a number of subjective decisions. The sheer number of choices one must make in the course of answering any sort of interesting question with data is overwhelming. You say, “We want to understand the behaviour of our returning customers”, I reply “What do you mean by customers? Define ‘returning’. And what sorts of behaviour are we interested in specifically?” Some of these are pivotal questions which simply must be answered. But others are micro-decisions, each of which only marginally effect on the results, but whose compound effect across such decisions can influence the entire outcome of an analysis. 1
Only when you know the question will you know what the answer means.
— Douglas Adams, The Hitchhiker’s Guide to the Galaxy
It is critical to have a firm grasp of your root question before starting an analysis. Having a firm grasp of that question lets you make smarter sub-decisions and makes you more likely to arrive at a useful outcome. The main challenge is that sometimes the question-asker sometimes doesn’t consider it necessary to show their full hand. Vulnerability does not come easy, after all.
Don’t be an SQL monkey
So given that you can’t directly influence the clarity of thinking of your stakeholders, what is a frustrated data analyst to do? Here are a few actionable tips which I try to run through each time I am facing a vaguely defined problem, in order to maximize my chance of ultimately reaching a successful outcome.
Crisply define terminology
Make sure you are fully aligned on what the terms you are using actually mean. Every business has a number of phrases which serve as weasel words. Here’s a few examples:
- Users → Paying customers or everyone with an account? What about non-logged-in “users”, which are really just tracking cookies in someone’s browser?
- Retention → This one is straightforward for subscription services, but more vaguely defined in a non-contractual setting. How frequently does a customer need to purchase to be considered “active”? What if they return and browse, but don’t purchase?
- New vs. returning → In relation to the above, do we start counting when a customer first visits, when the sign up, or when they buy?
Think through hypotheticals
A helpful way to draw out the meat of a decision is to ask what hypothetical action we would take for each possible outcome of the analysis. Consider drawing a decision tree (the diagram, not the machine learning model). Understanding the topology of a decision allows you to more carefully craft the analysis to inform that particular decision.
In the case of an A/B test: what is our default decision/action if results are inconculsive? Do we only launch if there is X% improvement in our KPIs, or do we launch as long as there is no noticable decline? What is X%? Working through this thought exercise will sharpen your intuition around the nature of the problem, making it easier to make better micro-decisions such as setting appropriate appropriate risk parameters (α, β) for the A/B test based on the business risk of a false positive or false negative outcome.
If it’s a visualization, draw a picture
Almost every request for a specific data visualization is actually a request for an artifact which your stakeholder believes will be useful for solving some underlying question which he or she has decided to keep hidden from you. Try to understand that underlying question.
But sometimes there is a need for just a good plain old chart or dashboard. In those cases, I have found it helpful to draw a picture of the output before starting. You can do this collaboratively with your stakeholder, or—if your drawing skills are as embarassingly poor as mine—you can sketch something out ahead and meet to align on it.
Based on your a priori domain knowledge, it is often possible to arrive at something reasonably similar in structure and content to the final piece of dataviz. Getting this prototype in front of your stakeholder before implementing it will frequently surface follow-up questions or revisions that would otherwise have costed you time for re-work. It may also help you identify gaps between the currently available data and the data required to answer the underlying question.
More data → more problems
There is pervasive desire for more and faster data, particularly among product managers. But besides adding unnecessary processing complexity, real-time analytics can actually provide negative benefit.
Adam Robinson has a great little story he tells on various podcasts about a study by psychologist Paul Slovic 2 which illustrates how additional data has diminishing returns for decision quality, but not for our confidence in our decisions. Beyond some point, additional data makes us no more accurate, but it makes us think we are more accurate.
When you’ve got 3 data points which disagree with your prior worldview, it’s tough to avoid the cognitive dissonance. It’s uncomfortable, but this is how scientific progress is made. But if you’ve got 30 data points and only ½ of them disagree, it’s a lot easier to tell yourself a story which reaffirms your worldview and sidesteps the cognitive dissonance. Unfortunately this cognitive comfort comes at the cost of a wrong decision.
Further reading
https://statmodeling.stat.columbia.edu/2012/11/01/researcher-degrees-of-freedom/ ↩︎
I often share a snippet from Matt Mullenweg’s blog, although I recall first hearing of this study on the Tim Ferriss show. ↩︎