Jupyter is an open-source tool for executing Python code in an interactive notebook environment.
Configuration
Boilerplate
This is the boilerplate code I use to initialize every notebook.
You can add boilerplate imports to ~/.ipython/profile_default/startup/0_notebook_defaults.py to be executed every time the kernel is initialized.
import os, sys
import datetime as dt
import numpy as np
import pandas as pd
import matplotlib.pyplot as plt
import seaborn as sns

%matplotlib inline
%reload_ext autoreload
%autoreload 2

from IPython.core.interactiveshell import InteractiveShell
InteractiveShell.ast_node_interactivity = 'all'  # display all output cells

from IPython.core.display import display, HTML
display(HTML("<style>.container { width:100% !important; }</style>"))  # make full width

pd.set_option('float_format', lambda x: '%.3f' % x)
pd.set_option('display.max_rows', 200)
np.set_printoptions(suppress=True, linewidth=180)
SQL syntax highlighting
Add the following lines to ~/.jupyter/custom/custom.js:
IPython.notebook.events.one('kernel_ready.Kernel',
    function(){
        IPython.CodeCell.config_defaults
               .highlight_modes['magic_text/x-mysql'] = {'reg':[/^%%sql/]} ;
        IPython.notebook.get_cells().map(
            function(cell){
                if (cell.cell_type == 'code'){
                    cell.auto_highlight();
            }
        }) ;
    }) ;
Features
Suppress output
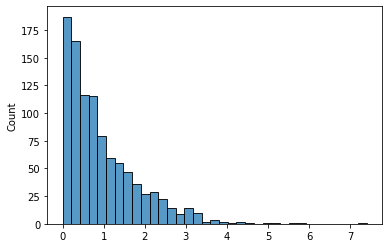
Add ; to the end of the line, useful when you want to prevent text output when plotting.
data = np.random.exponential(size=1000)
sns.histplot(data, kde=False)
<AxesSubplot:ylabel='Count'>
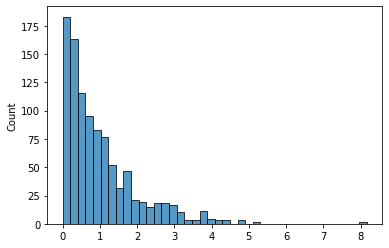
data = np.random.exponential(size=1000)
sns.histplot(data, kde=False);
Check python version
from platform import python_version

python_version()
'3.8.10'
Tips & tricks
Idempotent pip installs
If your notebook has dependecies, you can make it “one-click runnable” using !pip install -Uqq module.
This will silently install or upgrade a pip package, showing no output unless an error occurs.
Source: StackOverflow > pip install options unclear
Progress bars w/ tqdm
Source: how to make a nested tqdm bars on jupyter notebook
from time import sleep
from tqdm.notebook import tqdm
from IPython.display import clear_output
iters_outer = 3
iters_inner = 5
for i in tqdm(range(iters_outer), desc='Outer'):
for j in tqdm(range(iters_inner), desc='Inner', leave=(i==iters_outer-1)):
sleep(0.5)
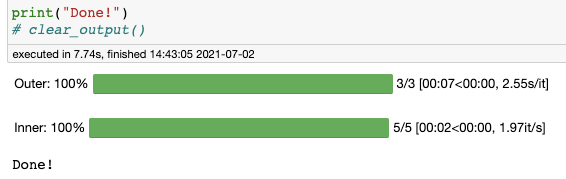
print("Done!")
clear_output()
The tqdm progress bars do not render properly when this notebook is converted to markdown, but below is a screenshot of what it looks like in-notebook.
Display outputs
Display HTML
from IPython.display import display, HTML

example_html = """
<h1>Title</h1>
<h2>Section</h2>
<p>Lorem ipsum dolor sit amet, consectetur adipiscing elit. Fusce a nisi nulla. Nulla nec egestas felis. Quisque nibh augue, semper ut imperdiet sit amet, porta aliquam sapien. Vivamus ornare viverra quam eget faucibus. Integer suscipit urna at cursus maximus. Quisque ut lacus tincidunt, viverra dolor vel, finibus diam. Nunc nibh metus, scelerisque sed malesuada eget, pulvinar in massa.</p>
<h2>Another section</h2>
<p>Lorem ipsum dolor sit amet, consectetur adipiscing elit. Fusce a nisi nulla. Nulla nec egestas felis. Quisque nibh augue, semper ut imperdiet sit amet, porta aliquam sapien. Vivamus ornare viverra quam eget faucibus. Integer suscipit urna at cursus maximus. Quisque ut lacus tincidunt, viverra dolor vel, finibus diam. Nunc nibh metus, scelerisque sed malesuada eget, pulvinar in massa.</p>
"""

display(HTML(example_html), metadata={'isolated': True})
Title
Section
Lorem ipsum dolor sit amet, consectetur adipiscing elit. Fusce a nisi nulla. Nulla nec egestas felis. Quisque nibh augue, semper ut imperdiet sit amet, porta aliquam sapien. Vivamus ornare viverra quam eget faucibus. Integer suscipit urna at cursus maximus. Quisque ut lacus tincidunt, viverra dolor vel, finibus diam. Nunc nibh metus, scelerisque sed malesuada eget, pulvinar in massa.
Another section
Lorem ipsum dolor sit amet, consectetur adipiscing elit. Fusce a nisi nulla. Nulla nec egestas felis. Quisque nibh augue, semper ut imperdiet sit amet, porta aliquam sapien. Vivamus ornare viverra quam eget faucibus. Integer suscipit urna at cursus maximus. Quisque ut lacus tincidunt, viverra dolor vel, finibus diam. Nunc nibh metus, scelerisque sed malesuada eget, pulvinar in massa.
Embed HTML as an iframe
import base64
from IPython.display import IFrame

css = """
<style>
    body {
        font-size: 80%;
        border: 1px solid black;
        padding: 10px;
        margin-right: 15px;
    }
</style>
"""

iframe_html = css + example_html

prefix = 'data:text/html;charset=utf-8;base64,'
payload = base64.b64encode(iframe_html.encode()).decode()
data_url = prefix + payload
IFrame(data_url, width=800, height=200)
Magics
Our test function
- Our function sleeps for $X \sim \text{Unif}(0, 1)$ seconds.
- So we expect an average latency of $E[ X ] = 0.5$ seconds, plus perhaps a tiny bit of overhead on calling the function.
- Our expected standard deviation is $S_X = \sqrt{\text{Var}(x)} = \sqrt{\tfrac{1}{12}(b-a)^2} \approx 0.28$.
from time import sleep
from random import random

def my_func():
    sleep(random())  # Random number in range [0, 1]
    return True
Timing execution
timeit magic
- Useful one-liner for calculating average execution time.
- Does not print return value of function.
Arguments
- Will execute the function a total of
n*rtimes - The
-nargument dictates how many loops from which to take the lowest time. - The
-rdictates how many runs, which are used for the±stats.
%timeit my_func()
565 ms ± 69.1 ms per loop (mean ± std. dev. of 7 runs, 10 loops each)
%timeit -r 100 -n 1 my_func()
The slowest run took 829.94 times longer than the fastest. This could mean that an intermediate result is being cached.
552 ms ± 302 ms per loop (mean ± std. dev. of 100 runs, 1 loop each)
%timeit -r 1 -n 100 my_func()
507 ms ± 0 ns per loop (mean ± std. dev. of 1 run, 100 loops each)
%timeit -r 10 -n 10 my_func()
576 ms ± 79.9 ms per loop (mean ± std. dev. of 10 runs, 10 loops each)
%timeit -r 50 -n 2 my_func()
The slowest run took 7.53 times longer than the fastest. This could mean that an intermediate result is being cached.
477 ms ± 168 ms per loop (mean ± std. dev. of 50 runs, 2 loops each)
So the best approach is to call timeit with arguments -r <n> -n 1, since otherwise it will underestimate the variability in run times.
Line profiling
!pip install -Uqq line_profiler

%reload_ext line_profiler

%lprun -f my_func my_func()
Memory profiling
Can be used for:
- Functions
- Objects →
sys.getsizeof(x)is not accurate, because it works for built-ins but not for custom-defined objects.
!pip install -Uqq memory_profiler

%reload_ext memory_profiler

%memit my_func()
peak memory: 51.43 MiB, increment: 0.00 MiB
Debugging
%debug magic (docs)
- Running this drops you into the last stack trace → useful for post-mortem debugging