import numpy as np
import pandas as pd
import matplotlib.pyplot as plt
import seaborn as sns
Package     Version
----------  ---------
python      3.8.8
matplotlib  3.4.3
seaborn     0.11.1
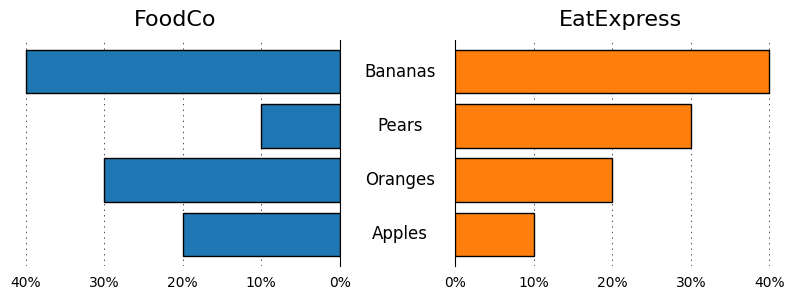
A butterfly chart is a useful format for visually contrasting the proportions between two groups, when a 2D bar chart may be too visually cluttered.
First, let’s create some dummy data…
data = pd.DataFrame({
    'FoodCo': [0.2, 0.3, 0.1, 0.4],
    'EatExpress': [0.1, 0.2, 0.3, 0.4]
}, index=['Apples', 'Oranges', 'Pears', 'Bananas'])

data
| FoodCo | EatExpress | |
|---|---|---|
| Apples | 0.2 | 0.1 |
| Oranges | 0.3 | 0.2 |
| Pears | 0.1 | 0.3 |
| Bananas | 0.4 | 0.4 |
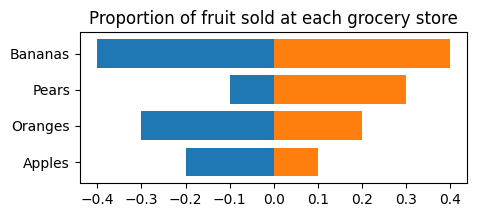
fig, ax = plt.subplots(figsize=(5, 2), dpi=100)

(l1, x1), (l2,x2) = data.items()

y = range(len(x1))
labels = data.index.tolist()
plt.yticks(y, labels)

plt.barh(y=y, width=-x1)
plt.barh(y=y, width=x2)

plt.title('Proportion of fruit sold at each grocery store')
plt.show()
import matplotlib.ticker as mtick
import matplotlib.transforms as transforms

def butterfly_chart(
        data: pd.DataFrame,
        title: str = None,
        middle_label_offset=0.01,
        figsize=(5, 2),
        wspace=0.6
    ):
    """ """

    plt.rcParams.update({
        # general
        'figure.facecolor': 'w',
        # font sizes
        'font.size': 12,
        'axes.titlesize': 16,
        'xtick.labelsize': 10,
        # force black border
        'patch.force_edgecolor': True,
        'patch.facecolor': 'black',
        # remove spines
        'axes.spines.bottom': False,
        'axes.spines.left': False,
        'axes.spines.right': False,
        'axes.spines.top': False,
        'xtick.bottom': False,
        'xtick.top': False,
        'axes.titlepad': 10,
        # grid
        'axes.grid': True,
        'grid.color': 'k',
        'grid.linestyle': ':',
        'grid.linewidth': 0.5,
        'lines.dotted_pattern': [1, 3],
        'lines.scale_dashes': False
    })

    fig, (ax1, ax2) = plt.subplots(
        figsize=figsize,
        dpi=100,
        nrows=1,
        ncols=2,
        subplot_kw={'yticks': []},
        gridspec_kw={'wspace': wspace},
    )


    # plot the data
    (l1, x1), (l2,x2) = data.items()
    y = range(len(x1))
    labels = data.index.tolist()

    ax1.barh(y=y, width=x1, color='tab:blue', zorder=3)
    ax1.invert_xaxis()
    ax1.set_title(l1)

    ax2.barh(y=y, width=x2, color='tab:orange', zorder=3)
    ax2.set_title(l2)

    # forced shared xlim
    x_max = max(ax1.get_xlim()[0], ax2.get_xlim()[0])
    ax1.set_xlim((x_max, 0))
    ax2.set_xlim((0, x_max))

    # turn on axes spines on the inside y-axis
    ax1.spines['right'].set_visible(True)
    ax2.spines['left'].set_visible(True)

    # format axes
    xfmt = mtick.PercentFormatter(xmax=1, decimals=0)
    ax1.xaxis.set_major_formatter(xfmt)
    ax2.xaxis.set_major_formatter(xfmt)

    # place center labels
    transform = transforms.blended_transform_factory(fig.transFigure, ax1.transData)
    for i, label in enumerate(labels):
        ax1.text(0.5+middle_label_offset, i, label, ha='center', va='center', transform=transform)

    plt.suptitle(title, y=1.05, fontsize='x-large')


butterfly_chart(
    data,
    figsize=(10, 3),
    wspace=0.35,
    middle_label_offset=0.015,
    #title='Proportion of fruit sold at each grocery store'
)

style_kwargs = {
    # general
    'figure.facecolor': 'w',
    # font sizes
    'font.size': 12,
    'axes.titlesize': 16,
    'xtick.labelsize': 10,
    # force black border
    'patch.force_edgecolor': True,
    'patch.facecolor': 'black',
    # remove spines
    'axes.spines.bottom': False,
    'axes.spines.left': False,
    'axes.spines.right': False,
    'axes.spines.top': False,
    'xtick.bottom': False,
    'xtick.top': False,
    'axes.titlepad': 10,
    # grid
    'axes.grid': True,
    'grid.color': 'k',
    'grid.linestyle': ':',
    'grid.linewidth': 0.5,
    'lines.dotted_pattern': [1, 3],
    'lines.scale_dashes': False
}

with mpl.rc_context(style_kwargs):
    butterfly_chart(
        data,
        figsize=(10, 3),
        wspace=0.35,
        middle_label_offset=0.015,
        #title='Proportion of fruit sold at each grocery store'
    )
📚 Further reading